It will be a long article so I added a Table of content 👇 Fancy, right?
- Crawl an entire website with Rcrawler
- So how to extract metadata while crawling?
- Explore Crawled Data with rpivottable
- Extract more data without having to recrawl
- Categorize URLs using Regex
- What if I want to follow robots.txt rules?
- What if I want to limit crawling speed?
- What if I want to crawl only a subfolder?
- How to change user-agent?
- What if my IP is banned?
- Where are the internal Links?
- Count Links
- Compute ‘Internal Page Rank’
- What if a website is using a JavaScript framework like React or Angular?
- So what’s the catch?
This tutorial is relying on a package called Rcrawler by Salim Khalil. It’s a very handy crawler with some nice native functionalities.
After R is being installed and rstudio launched, same as always, we’ll install and load our package:
|
1 2 3 4 |
# install to be run once install.packages("Rcrawler") # and loading library(Rcrawler) |
Crawl an entire website with Rcrawler
To launch a simple website analysis, you only need this line of code:
|
1 |
Rcrawler(Website = "https://www.gokam.co.uk/") |
It will crawl the entire website and provide you with the data
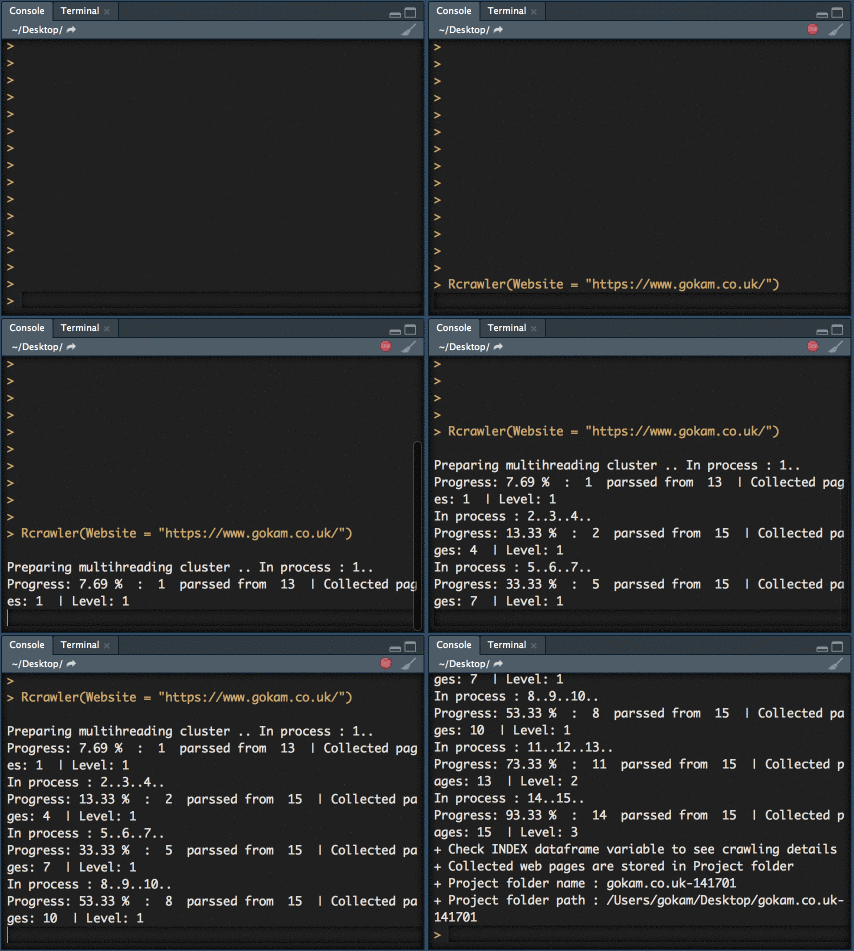
After the crawl is being done, you’ll have access to:
The INDEX variable
it’s a data frame, if don’t know what’s a data frame, it’s like an excel file. Please note that it will be overwritten every time so export it if you want to keep it!
To take a look at it, just run
|
1 |
View(INDEX) |
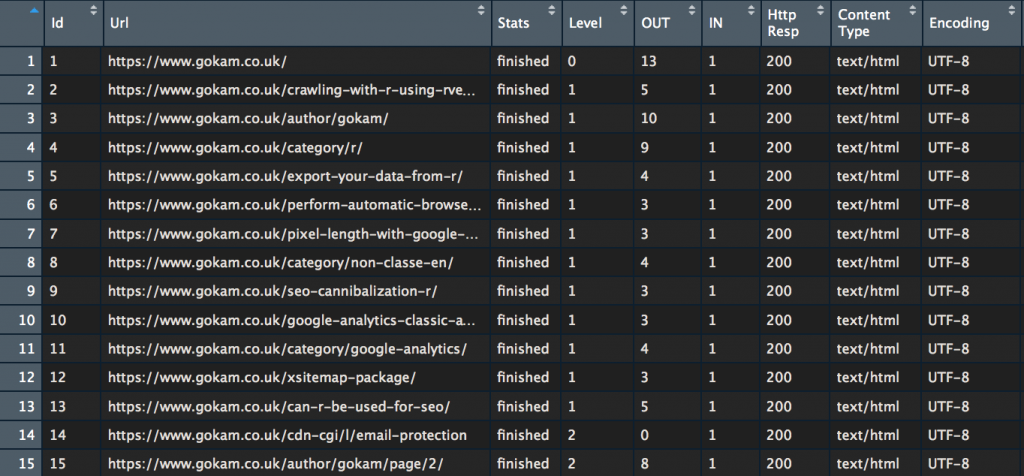
Most of the columns are self-explanatory. Usually, the most interesting ones are ‘Http Resp‘ and ‘Level‘
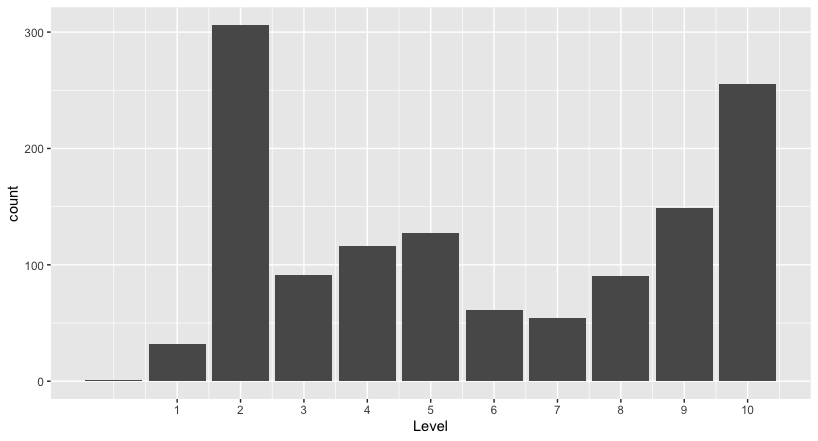
The Level is what SEOs call “crawl depth” or “page depth”. With it, you can easily check how far from the homepage some webpages are.
Quick example with BrightonSEO website, let’s do a quick ‘ggplot’ and we’ll be able to see pages distribution by level.
|
1 2 3 4 5 6 7 8 9 10 11 12 13 14 15 16 17 18 19 20 21 22 23 24 |
#here the code to run to see the plot # install ggplot plot library to be run once install.packages("ggplot2") # Loading library library(ggplot2) # Convert Level to number INDEX$Level <- as.integer(INDEX$Level) # Make plot # 1 define dimensions (only 'Level') # 2 set up the plot type # 3 customise the x scale, easier to read ggplot(INDEX, aes(x=Level))+ geom_bar()+ scale_x_continuous(breaks=c(1:10)) #alternative command to count webpages per Level table(INDEX$Level) # Should display something like that: # 0 1 2 3 4 5 6 7 8 9 10 # 1 32 306 91 116 127 61 54 90 149 255 |
HTML Files
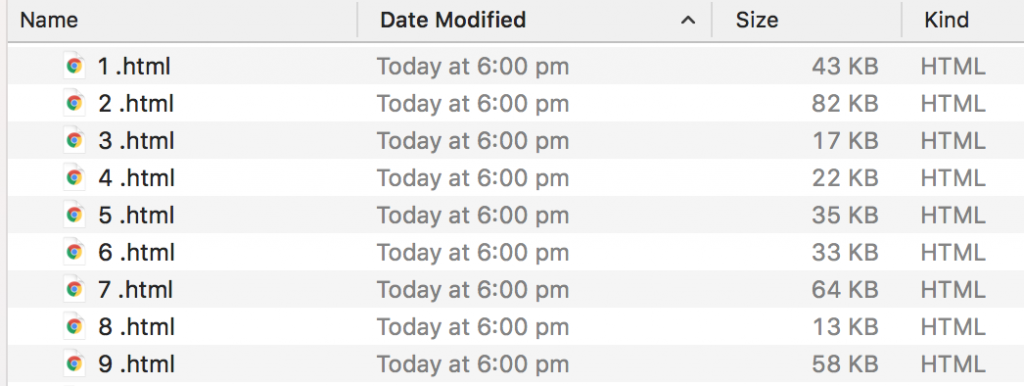
By default, the rcrawler function also store HTML files in your ‘working directory’. Update location by running setwd() function
Let’s go deeper into options by replying to the most commons questions:
So how to extract metadata while crawling?
It’s possible to extract any elements from webpages, using a CSS or XPath selector. We’ll have to use 2 new parameters
- PatternsNames to name the new parameters
- ExtractXpathPat or ExtractCSSPat to setup where to grab it in the web page
Let’s take an example:
|
1 2 3 4 5 6 7 8 9 10 11 12 13 14 15 16 17 18 |
#what we want to extract CustomLabels <- c("title", "h1", "canonical tag", "meta robots", "hreflang", "body class") # How to grab it CustomXPaths <- c("///title", "///h1", "//link[@rel='canonical']/@href", "//meta[@rel='robots']/@content", "//link[@rel='alternate']/@hreflang", "//body/@class") Rcrawler(Website = "https://www.brightonseo.com/", ExtractXpathPat = CustomXPaths, PatternsNames = CustomLabels) |
You can access the scraped data in two ways:
- option 1 = DATA – it’s an environment variable that you can directly access using the console. A small warning, it’s a ‘list’ a little less easy to read
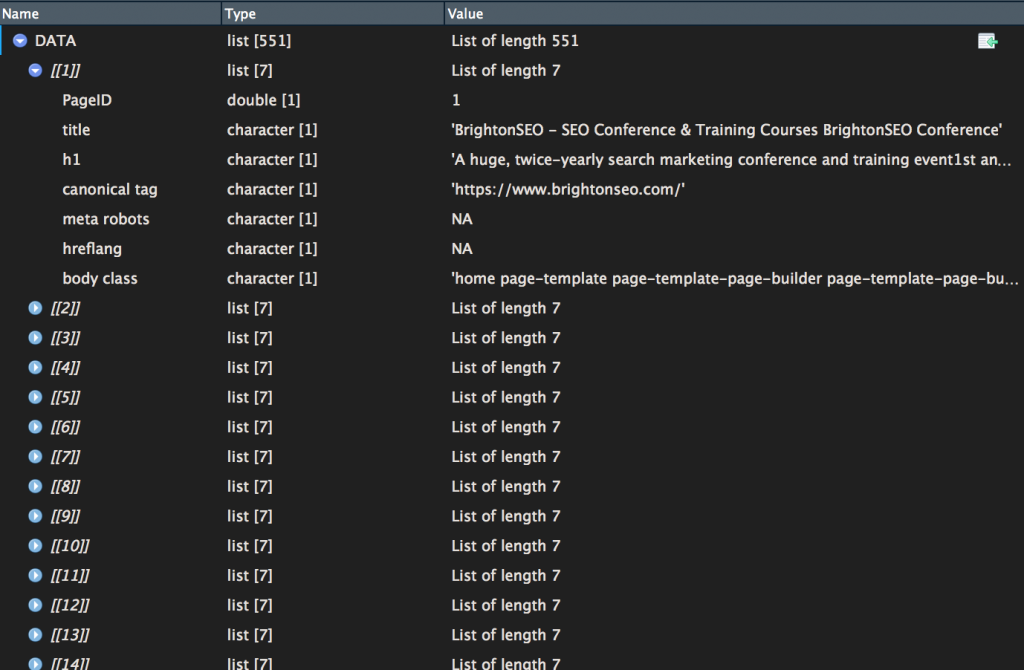
If you want to convert it to a data frame, easier to deal with, here the code:
|
1 |
NEWDATA <- data.frame(matrix(unlist(DATA), nrow=length(DATA), byrow=T)) |
- option 2 = extracted_data.csv
It’s a CSV file that has been saved inside your working directory along with the HTML files.
It might be useful to merge INDEX and NEWDATA files, here the code
|
1 |
MERGED <- cbind(INDEX,NEWDATA) |
As an example, let’s try to collect webpage type using scraped body class
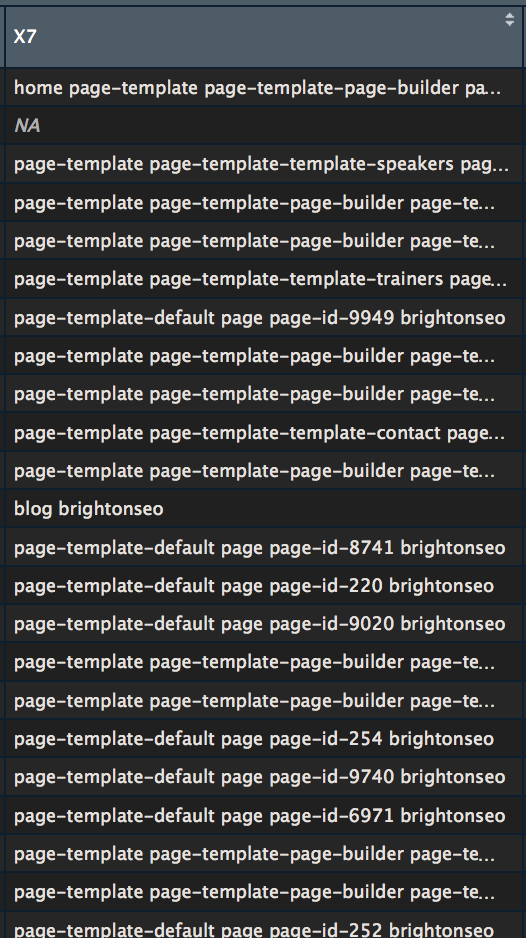
Let’s extract the first word and feed it inside a new column
|
1 |
MERGED$pagetype <- str_split_fixed(MERGED$X7, " ", 2)[,1] |
A little bit a cleaning to make the labels easier to read
|
1 2 3 |
MERGED$pagetype_short <- str_replace(MERGED$pagetype, "-default", "") MERGED$pagetype_short <- str_replace(MERGED$pagetype_short, "-template", "") #it's basically deleting "-default" and "-template" from strings as it doesn't help that much understanding data |
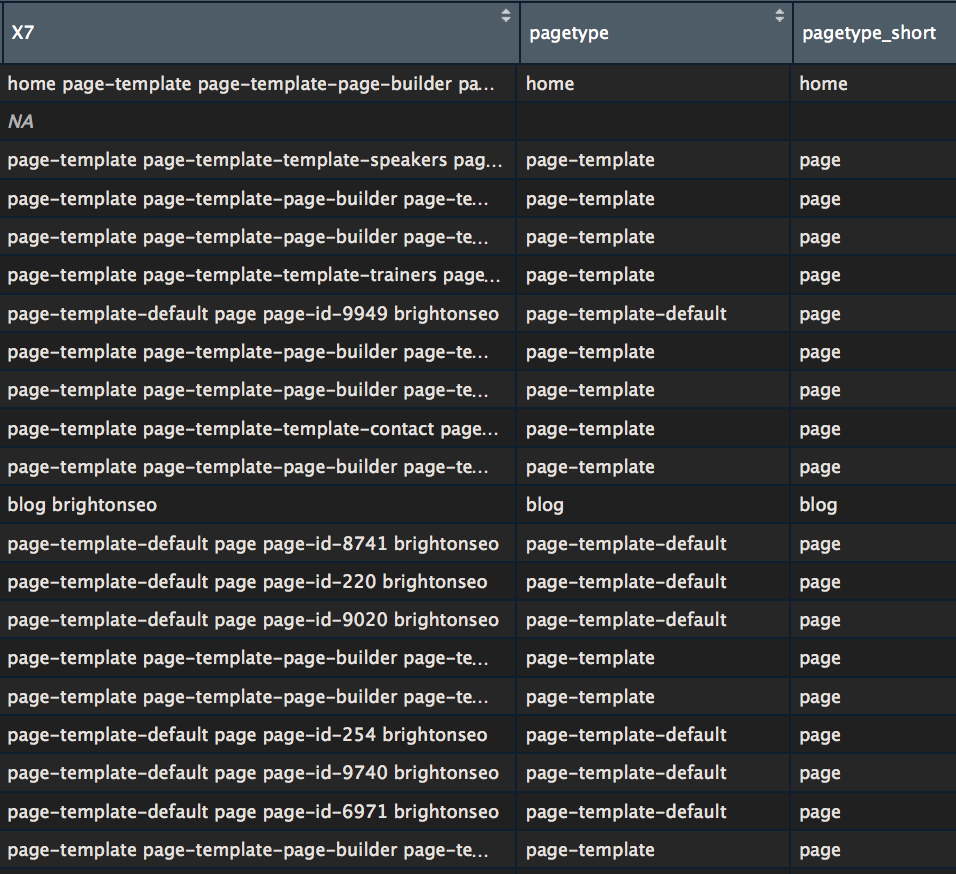
And then a quick ggplot
|
1 2 3 4 5 |
library(ggplot2) p <- ggplot(MERGED, aes(x=Level, fill=pagetype_short))+ geom_histogram(stat="count")+ scale_x_continuous(breaks=c(1:10)) p |
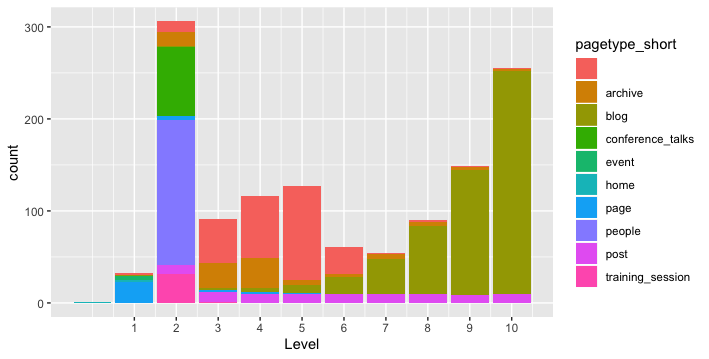
Want to see something even cooler?
|
1 2 3 4 |
#install package plotly the first time #install.packages("plotly") library(plotly) ggplotly(p, tooltip = c("count","pagetype_short")) |
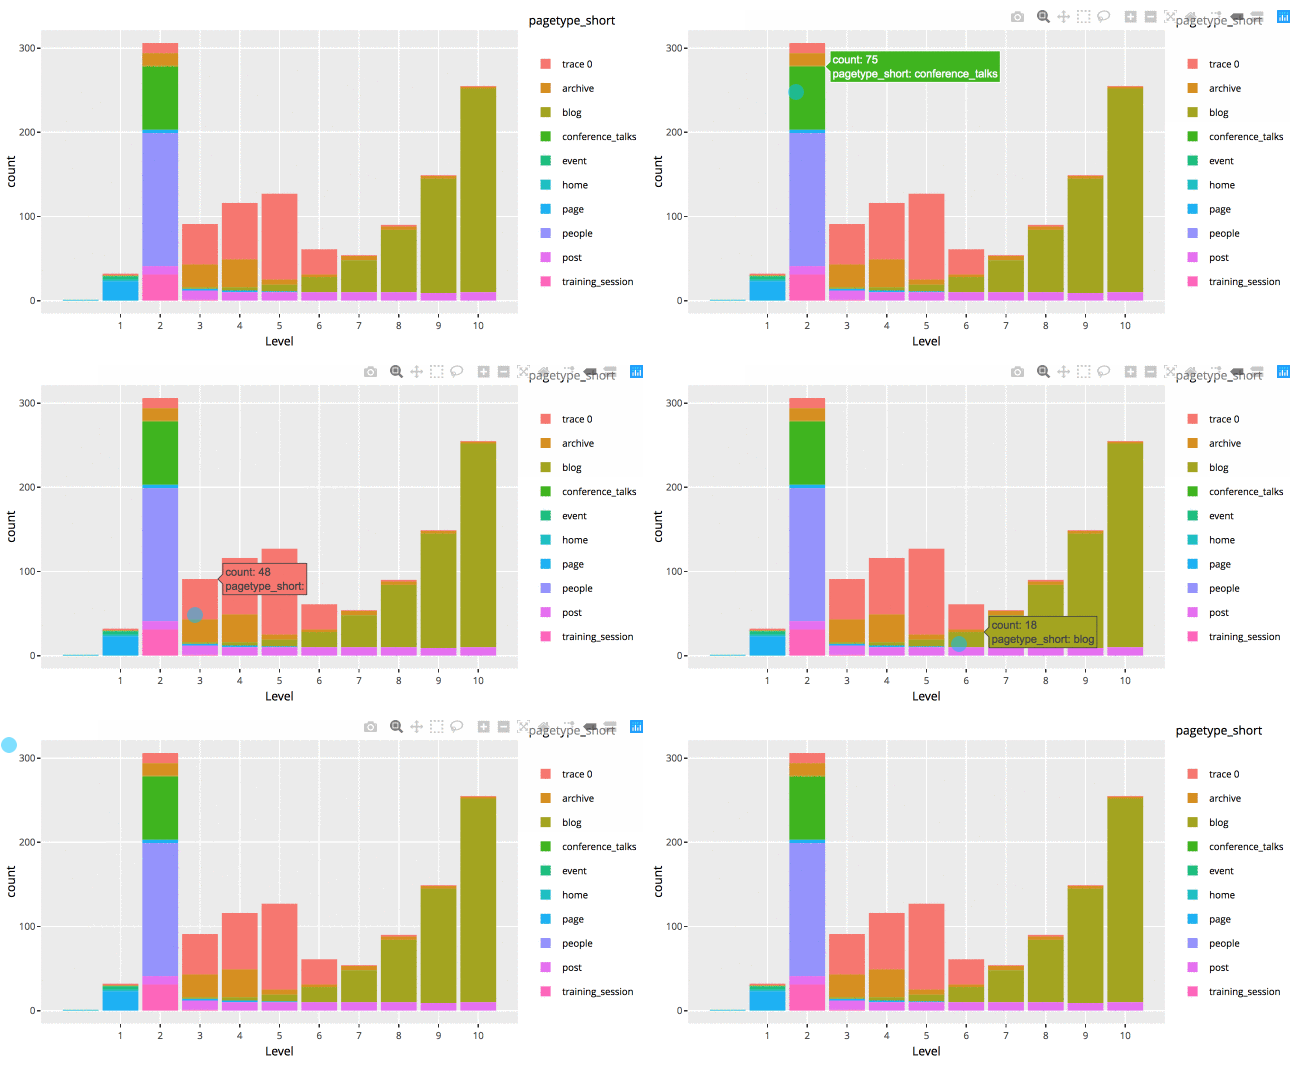
This is a static HTML file that can be store anywhere, even on my shared hosting
Explore Crawled Data with rpivottable
|
1 2 3 4 5 6 |
#install package rpivottable the first time #install.packages("rpivottable") # And loading library(rpivottable) # launch tool rpivotTable(MERGED) |
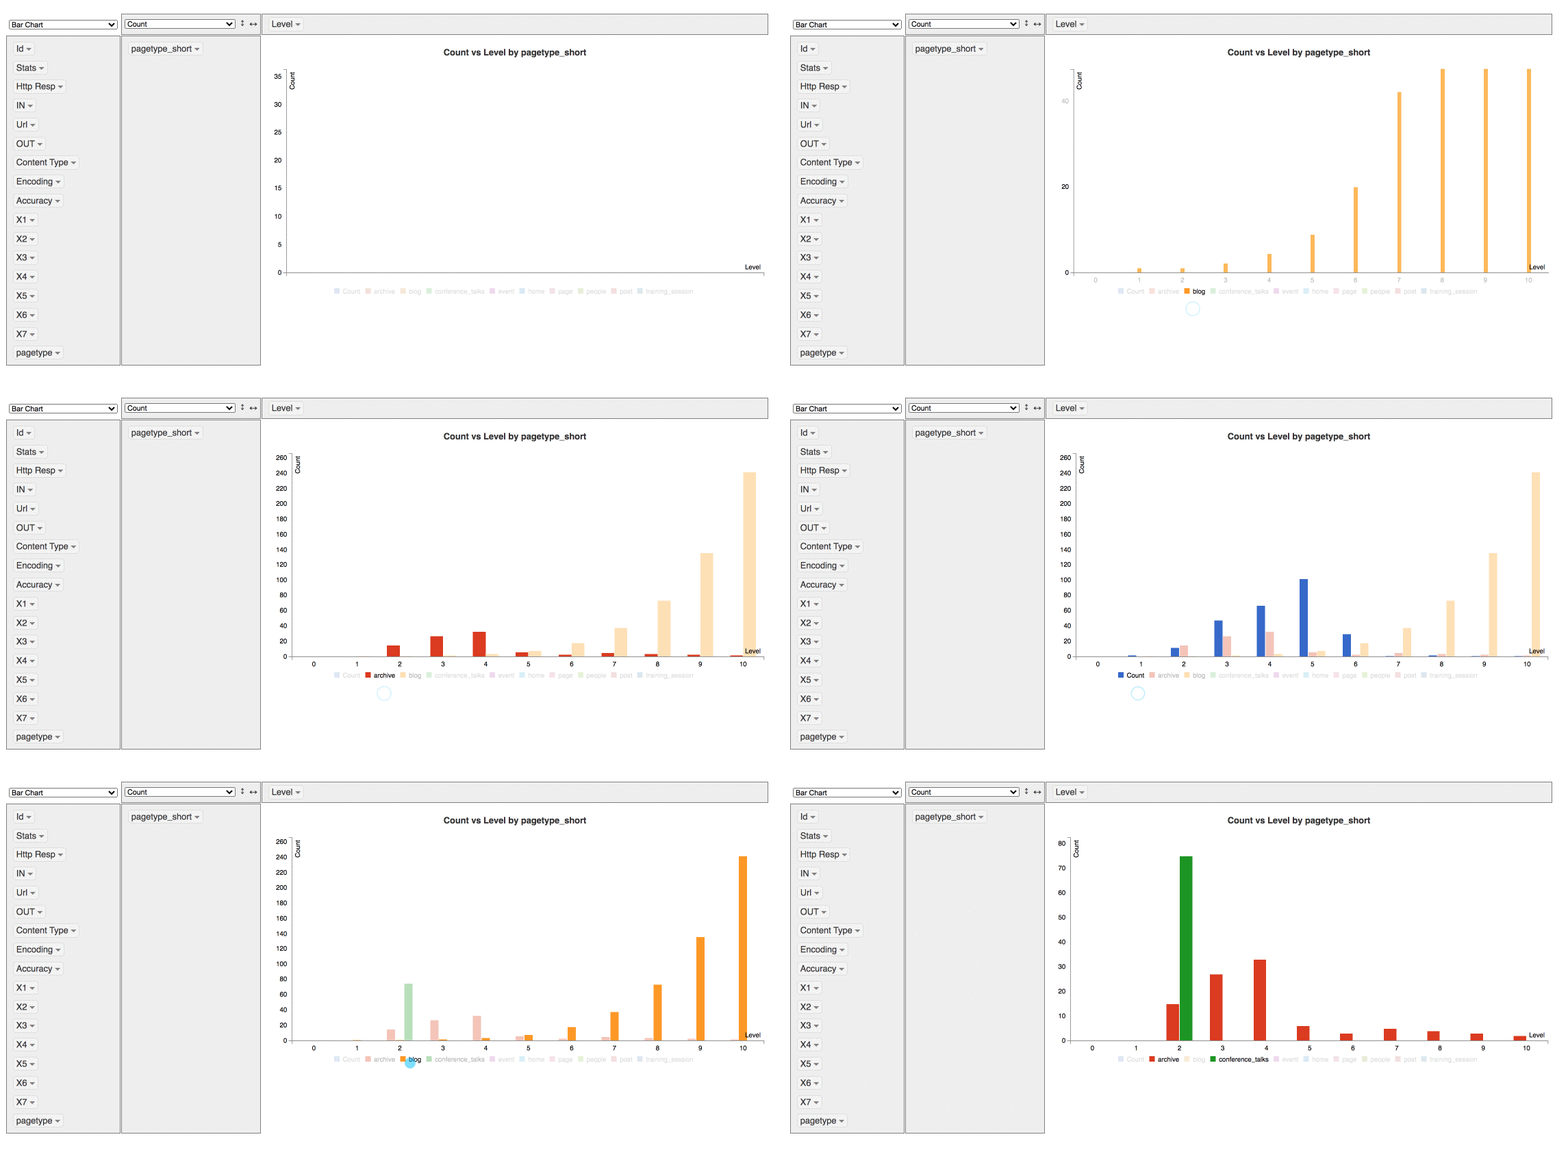
This create a drag & drop pivot explorer
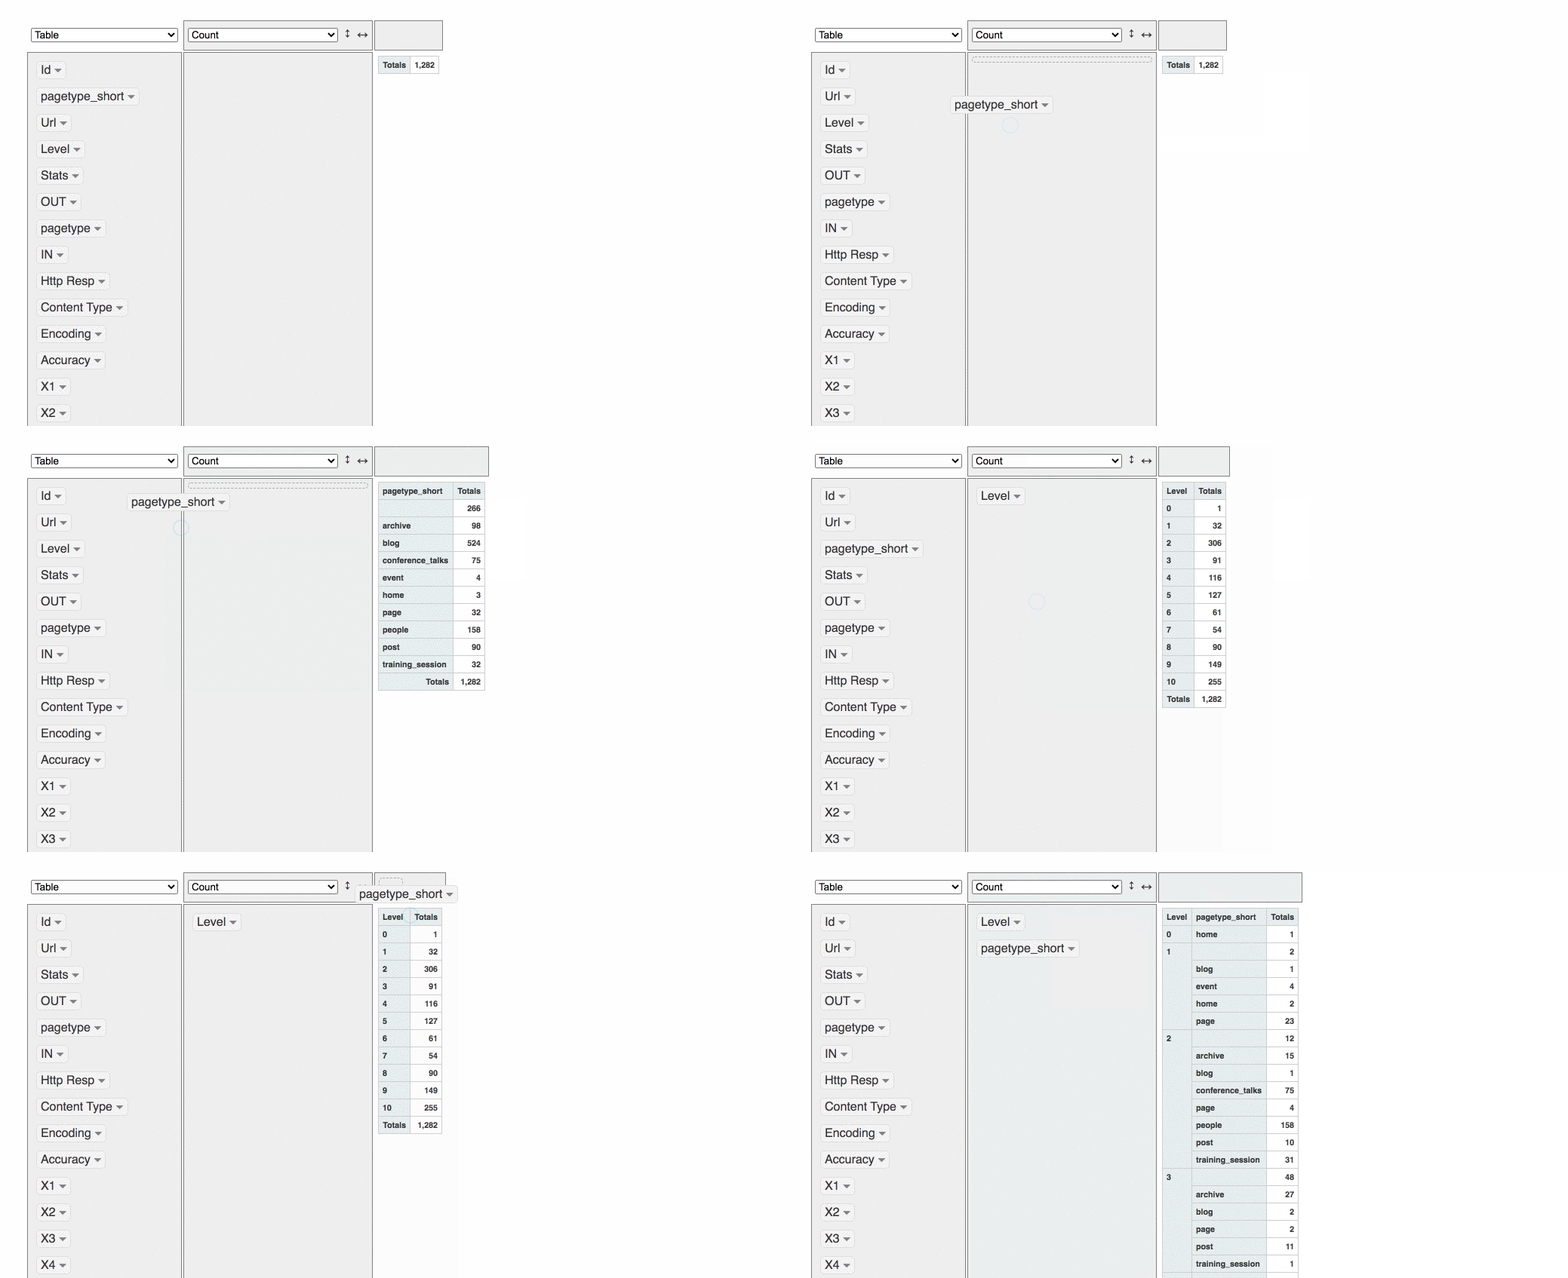
It’s also possible make some quick data viz
Extract more data without having to recrawl
All the HTML files are in your hard drive, so if you need more data extracted, it’s entirely possible.
You can list of your recent crawl by using ListProjects() function,

First, we’re going to load the crawling project HTML files:
|
1 2 3 |
LastHTMLDATA <- LoadHTMLFiles("gokam.co.uk-242115", type = "vector") # or to simply grab the last one: LastHTMLDATA <- LoadHTMLFiles(ListProjects()[1], type = "vector") |
|
1 2 3 |
LastHTMLDATA <- as.data.frame(LastHTMLDATA) colnames(LastHTMLDATA) <- 'html' LastHTMLDATA$html <- as.character(LastHTMLDATA$html) |
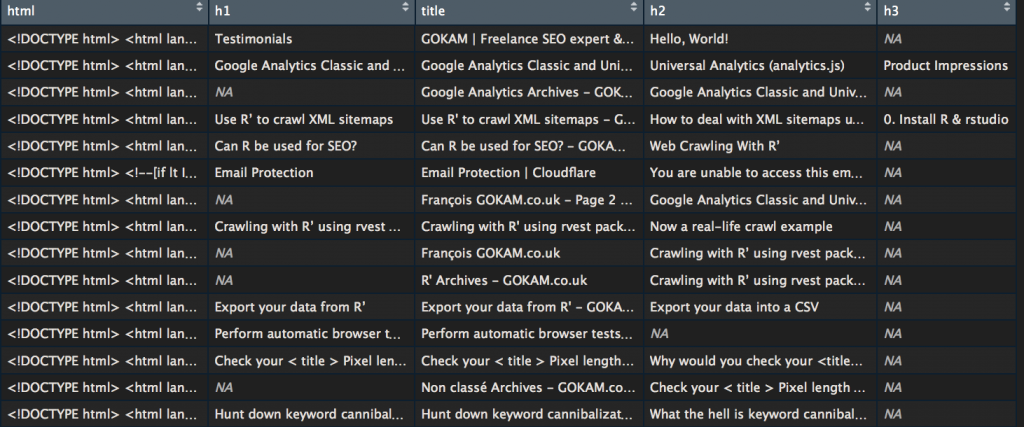
Let’s say you forgot to grab h2’s and h3’s you can extract them again using the ContentScraper() also included inside rcrawler package.
|
1 2 3 4 5 6 |
for(i in 1:nrow(LastHTMLDATA)) { LastHTMLDATA$title[i] <- ContentScraper(HTmlText = LastHTMLDATA$html[i] ,XpathPatterns = "//title") LastHTMLDATA$h1[i] <- ContentScraper(HTmlText = LastHTMLDATA$html[i] ,XpathPatterns = "//h1") LastHTMLDATA$h2[i] <- ContentScraper(HTmlText = LastHTMLDATA$html[i] ,XpathPatterns = "//h2") LastHTMLDATA$h3[i] <- ContentScraper(HTmlText = LastHTMLDATA$html[i] ,XpathPatterns = "//h3") } |
Categorize URLs using Regex
For those not afraid of regex, here is a complimentary script to categorize URLs. Be careful the regex order is important, some values can overwrite others. Usually, it’s a good idea to place the home page last
|
1 2 3 4 5 6 7 8 9 10 11 12 13 14 15 16 17 18 19 20 21 22 23 24 25 26 27 28 29 30 31 32 33 |
# define a default category INDEX$UrlCat <- "Not match" # create category name category_name <- c("Category", "Dates", "author page", "Home page") # create category regex, must be the same length category_regex <- c("category", "2019", "author","example\.com.\/$") # categorize for(i in 1:length(category_name)){ # display a dot to show the progress cat(".") # run regex test and update value if it matches # otherwise leave the previous value INDEX$UrlCat <- ifelse(grepl(category_regex[i], INDEX$Url, ignore.case = T), category_name[i], INDEX$UrlCat) } # View variable to debug View(INDEX) |
What if I want to follow robots.txt rules?
just had Obeyrobots parameter
|
1 2 |
#like that Rcrawler(Website = "https://www.gokam.co.uk/", Obeyrobots = TRUE) |
What if I want to limit crawling speed?
By default, this crawler is rather quick and can grab a lot of webpage in no times. To every advantage an inconvenience, it’s fairly easy to wrongly detected as a DOS. To limit the risks, I suggest you use the parameter RequestsDelay. it’s the time interval between each round of parallel HTTP requests, in seconds. Example
|
1 2 |
# this will add a 10 secondes delay between Rcrawler(Website = "https://www.example.com/", RequestsDelay=10) |
Other interesting limitation options:
no_cores: specify the number of clusters (logical cpu) for parallel crawling, by default it’s the numbers of available cores.
no_conn: it’s the number of concurrent connections per one core, by default it takes the same value of no_cores.
What if I want to crawl only a subfolder?
2 parameters help you do that. crawlUrlfilter will limit the crawl, dataUrlfilter will tell from which URLs data should be extracted
|
1 |
Rcrawler(Website = "http://www.glofile.com/sport/", dataUrlfilter ="/sport/", crawlUrlfilter="/sport/" ) |
How to change user-agent?
|
1 2 |
#as simply as that Rcrawler(Website = "http://www.example.com/", Useragent="Mozilla 3.11") |
What if my IP is banned?
option 1: Use a VPN on your computer
Option 2: use a proxy
Use the httr package to set up a proxy and use it
|
1 2 3 4 |
# create proxy configuration proxy <- httr::use_proxy("190.90.100.205",41000) # use proxy configuration Rcrawler(Website = "https://www.gokam.co.uk/", use_proxy = proxy) |
Where to find proxy? It’s been a while I didn’t need one so I don’t know.
Where are the internal Links?
By default, RCrawler doesn’t save internal links, you have to ask for them explicitly by using NetworkData option, like that:
|
1 |
Rcrawler(Website = "https://www.gokam.co.uk/", NetworkData = TRUE) |
Then you’ll have two new variables available at the end of the crawling:
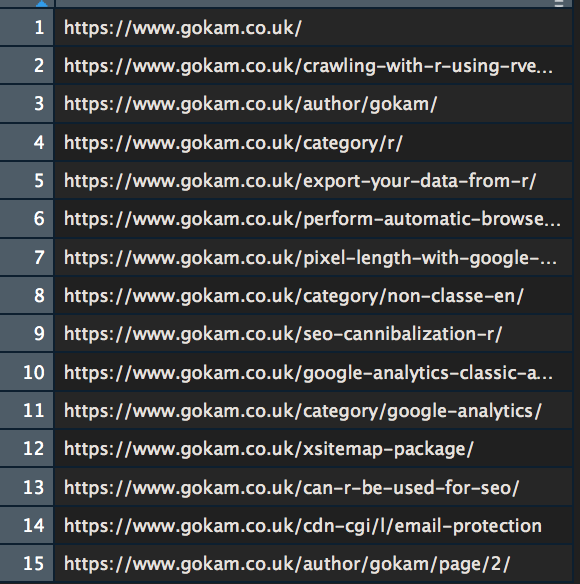
- NetwIndex var that is simply all the webpage URLs. The row number are the same than locally stored HTML files, so
row n°1 = homepage = 1.html
- NetwEdges with all the links. It’s a bit confusing so let me explain:
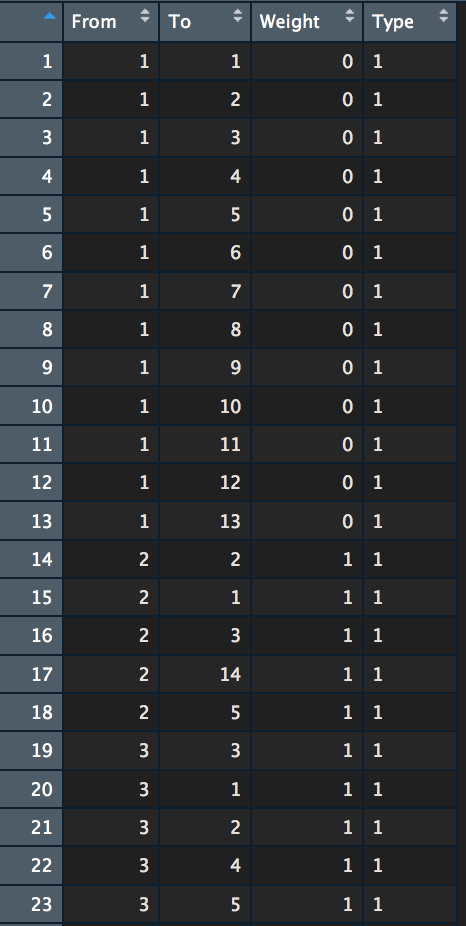
Each row is a link. From and To columns indicate “from” which page “to” which page are each link.
On the image above:
row n°1 is a link from homepage (page n°1) to homepage
row n°2 is a link from homepage to webpage n°2. According to NetwIndex variable, page n°2 is the article about rvest.
etc…
Weight is the Depth level where the link connection has been discovered. All the first rows are from the homepage so Level 0.
Type is either 1 for internal hyperlinks or 2 for external hyperlinks
Count Links
I guess you guys are interested in counting links. Here is the code to do it. I won’t go into too many explanations, it would be too long. if you are interested (and motivated) go and check out the dplyr package and specifically Data Wrangling functions
Count outbound links
|
1 2 3 4 5 6 7 8 9 |
count_from <- NetwEdges[,1:2] %>% #grabing the first two columns distinct() %>% # if there are several links from and to the same page, the duplicat will be removed. group_by(From) %>% summarise(n = n()) # the counting View(count_from) # we want to view the results |
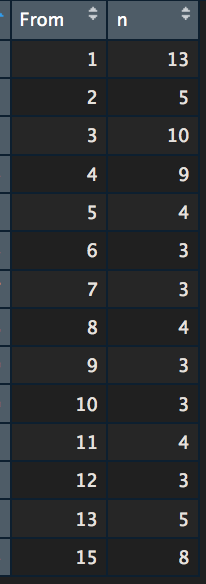
To make it more readable let’s replace page IDs with URLs
|
1 2 |
count_from$To <- NetwIndex View(count_from) |
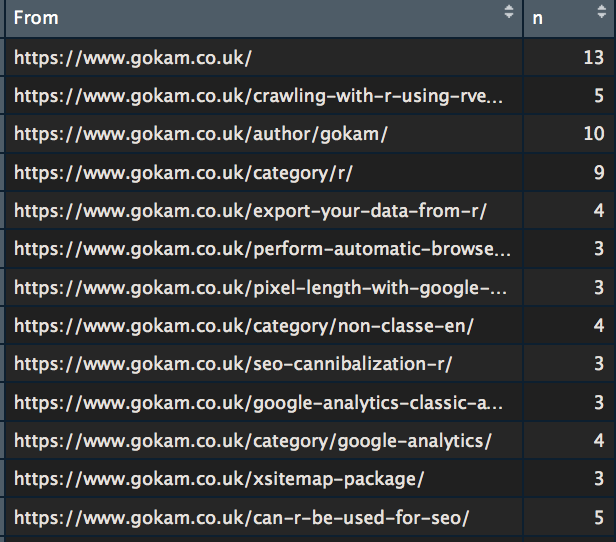
Count inbound links
The same thing but the other way around
|
1 2 3 4 5 6 7 8 9 10 |
count_to -> NetwEdges[,1:2] %>% #grabing the first two columns distinct() %>% # if there are several links from and to the same page, the duplicat will be removed. group_by(To) %>% summarise(n = n()) # the counting View(count_to) # we want to view the results |

Again to make it more readable
|
1 2 |
count_to$To <- NetwIndex View(count_to) |
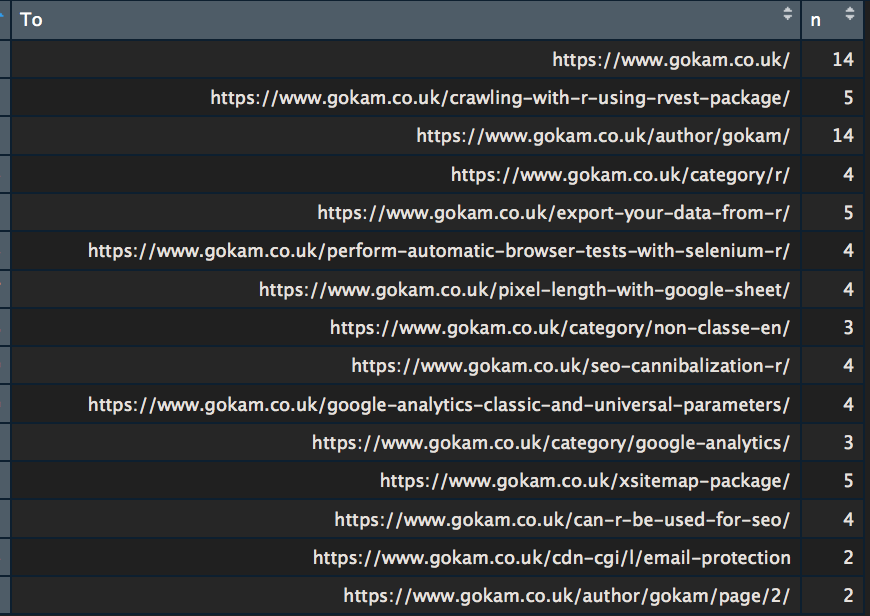
So the useless ‘author page‘ has 14 links pointing at it, as many as the homepage… Maybe I should fix this one day.
Compute ‘Internal Page Rank’
Many SEOs, I spoke to, seem to be very interested in this. I might as well add here the tutorial. It is very much an adaptation of Paul Shapiro awesome Script.
But Instead of using ScreamingFrog export file, we will use the previously extracted links.
|
1 2 3 4 5 6 7 8 9 10 11 12 13 14 15 16 17 18 19 20 21 22 23 24 |
links <- NetwEdges[,1:2] %>% #grabing the first two columns distinct() # loading igraph package library(igraph) # Loading website internal links inside a graph object g <- graph.data.frame(links) # this is the main function, don't ask how it works pr <- page.rank(g, algo = "prpack", vids = V(g), directed = TRUE, damping = 0.85) # grabing result inside a dedicated data frame values <- data.frame(pr$vector) values$names <- rownames(values) # delating row names row.names(values) <- NULL # reordering column values <- values[c(2,1)] # renaming columns names(values)[1] <- "url" names(values)[2] <- "pr" View(values) |
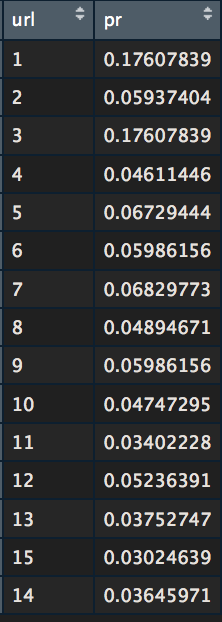
Let make it more readable, we’re going to put the number on a ten basis, just like when the PageRank was a thing.
|
1 2 3 4 5 6 |
#replacing id with url values$url <- NetwIndex # out of 10 values$pr <- round(values$pr / max(values$pr) * 10) #display View(values) |
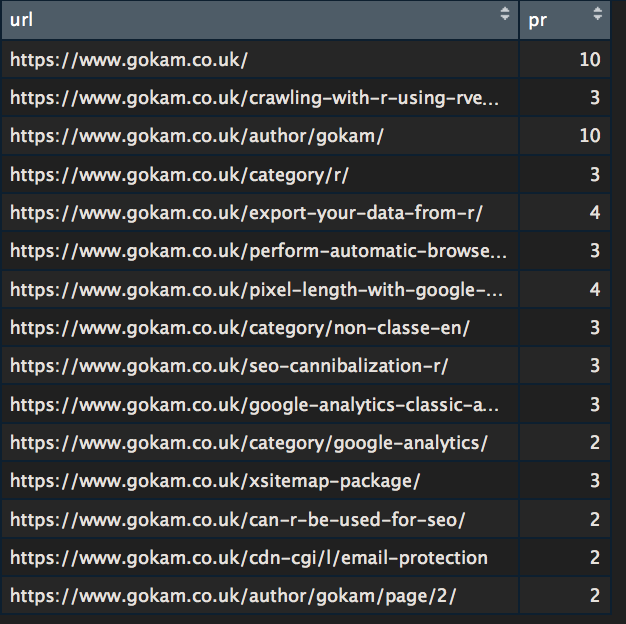
On 15 webpages website, it’s not very impressive but I encourage you to try on a bigger website.
What if a website is using a JavaScript framework like React or Angular?
RCrawler handly includes Phantom JS, the classic headless browser.
Here is how to to use
|
1 2 3 4 5 6 |
# Download and install phantomjs headless browser # takes 20-30 seconds usually install_browser() # start browser process br <-run_browser() |
After that, reference it as an option
|
1 2 3 4 |
Rcrawler(Website = "https://www.example.com/", Browser = br) # don't forget to stop browser afterwards stop_browser(br) |
It’s fairly possible to run 2 crawls, one with and one without, and compare the data afterwards
This Browser option can also be used with the other Rcrawler functions.
⚠️ Rendering webpage means every Javascript files will be run, including Web Analytics tags. If you don’t take the necessary precaution, it’ll change your Web Analytics data
So what’s the catch?
Rcrawler is a great tool but it’s far from being perfect. SEO will definitely miss a couple of things like there is no internal dead links report, It doesn’t grab nofollow attributes on Links and there is always a couple of bugs here and there, but overall it’s a great tool to have.
Another concern is the git repo which is quite inactive.
This is it. I hope you did find this article useful, reach to me for slow support, bugs/corrections or ideas for new articles. Take care.
ref:
Khalil, S., & Fakir, M. (2017). RCrawler: An R package for parallel web crawling and scraping. SoftwareX, 6, 98-106.


