If you want to crawl a couple of URLs for SEO purposes, there are many many ways to do it but one of the most reliable and versatile packages you can use is rvest
Here is a simple demo from the package documentation using the IMDb website:
|
1 2 3 4 5 |
# Package installation, instruction to be run only once install.packages("rvest") # Loading rvest package library(rvest) |
The first step is to crawl the URL and store the webpage inside a ‘lego_movie’ variable.
|
1 |
lego_movie <- read_html("http://www.imdb.com/title/tt1490017/") |
Quite straightforward, isn’t it?
Beware lego_move is now an xml_document that need to be parse in order to extract the data. Here is how to do it:
|
1 2 3 4 |
rating <- lego_movie %>% html_nodes("strong span") %>% html_text() %>% as.numeric() |
For those who don’t know %>% operator is like the | ( “pipe”) for a terminal command line. The operations are carried out successively. Meaning the results of the previous command are the entries for the next one.
html_nodes() function will extract from our webpage, HTML tags that match CSS style query selector. In this case, we are looking for a <span> tag whose parent is a <strong> tag.
then script will extract the inner text value using html_text() then convert it to a number using as.numeric().
Finally, it will store this value inside rating variable to display the value just write:
|
1 2 3 |
rating # it should display > [1] 7.8 |
Let’s take another example. This time we are going to grab the movies’ cast.
Having a look at the HTML DOM, it seems that we need to grab an HTML <img> tag who’s parent tag have ‘titleCast’ as an id and ‘primary_photo’ as a class name and then we’ll need to extract the alt attribute
|
1 2 3 4 5 6 7 8 9 10 11 12 |
cast <- lego_movie %>% html_nodes("#titleCast .primary_photo img") %>% html_attr("alt") cast # Should display: # > [1] "Will Arnett" "Elizabeth Banks" "Craig Berry" # > [4] "Alison Brie" "David Burrows" "Anthony Daniels" # > [7] "Charlie Day" "Amanda Farinos" "Keith Ferguson" # > [10] "Will Ferrell" "Will Forte" "Dave Franco" # > [13] "Morgan Freeman" "Todd Hansen" "Jonah Hill" |
Last example, we want the movie poster url. First step is to grab <img> tag who’s parent have a class name ‘poster’ Then extract src attribute and display it
|
1 2 3 4 5 6 7 8 |
poster <- lego_movie %>% html_nodes(".poster img") %>% html_attr("src") poster # Shoudl display: # [1] "https://m.media-amazon.com/images/M/MV5BMTg4MDk1ODExN15BMl5BanBnXkFtZTgwNzIyNjg3MDE@.<em>V1_UX182_CR0,0,182,268_AL</em>.jpg" |
Now a real-life crawl example
Now that we’ve seen an example by the book. We’ll switch to something more useful and a little bit more complex. Using the following tutorial, you’ll be able to extract the review score of any WordPress plugins over time.
For example here are the stats for Yoast, the famous SEO plugin:
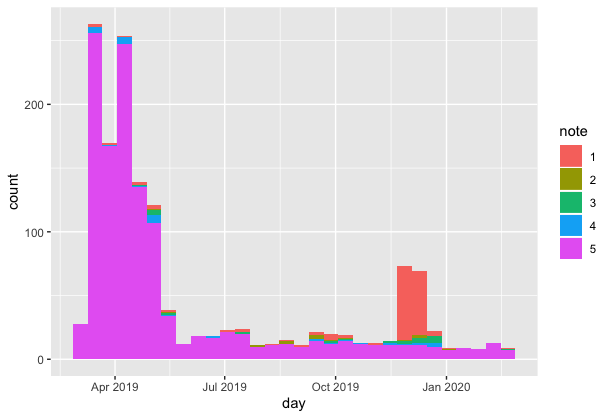
Here are the ones’ for All in one SEO, his competitor
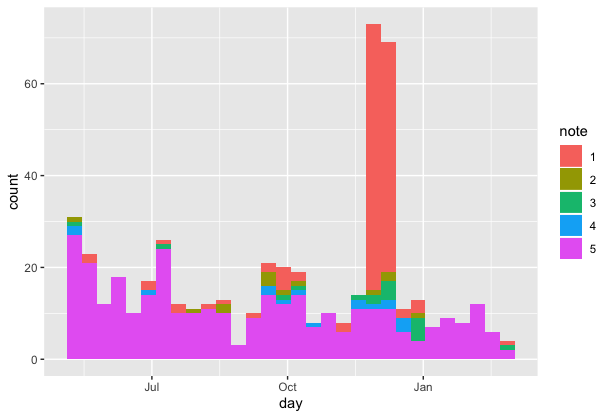
Very useful to follow if your favourite plugin new release is well received or not.
But before that, a little warning, the source code I’m about to show you has been made by me. It’s full of flaws, couple of stack overflow copypasta but… it works. 😅 So Dear practitioners please don’t judge me
It’s one of the beauties of R, you get your ends relatively easily.
(but I gladly accept any ideas to make this code easier for beginner, don’t hesitate to contact me)
So let’s get to it, the first step is to grab a reviews page URL. On this one, we have 49 pages of reviews.
We’ll have to make a loop to run into each pagination. Another problem is that no dates are being displayed but only durations, so we’ll have to convert them.
As usual, we’ll first load the necessary packages. If there are not installed yet, run the install.packages() function as seen before.
|
1 2 3 |
#Loading packages library(tidyverse) library(rvest) |
|
1 2 3 4 5 6 7 8 9 10 11 12 13 14 15 16 17 18 19 20 21 22 23 |
# we store plugin url inside a variable, to make the code easy to reuse pluginurl <- "https://wordpress.org/support/plugin/wp-fastest-cache/" # we create and empty dataframe to receive the data that will be retrieved from each pagination. If you don't know what's a data frame think of them as excel file all_reviews <- data.frame() ##### beginning of the LOOP #### # if copy past stuff, don't forget to grab the code until the end of the loop at least for(i in 1:49) { # sending to console the loop status # paste0() function is just a concatenation function with a weird name message(paste0("Page ",i)) # faculative: make a small break betweeh each loop iteration # this pause the loop for 2 secondes # Sys.sleep(2) # we grab the webpage and store the result inside html_page variable to be able to reuse it several times html_page <- read_html(paste0(pluginurl,"reviews/page/",i,"/")) # html_nodes is function that use the css or xpath to extract the value from the html page. This part is to extract the number of stars reviews <- html_nodes(html_page, ".wporg-ratings") |
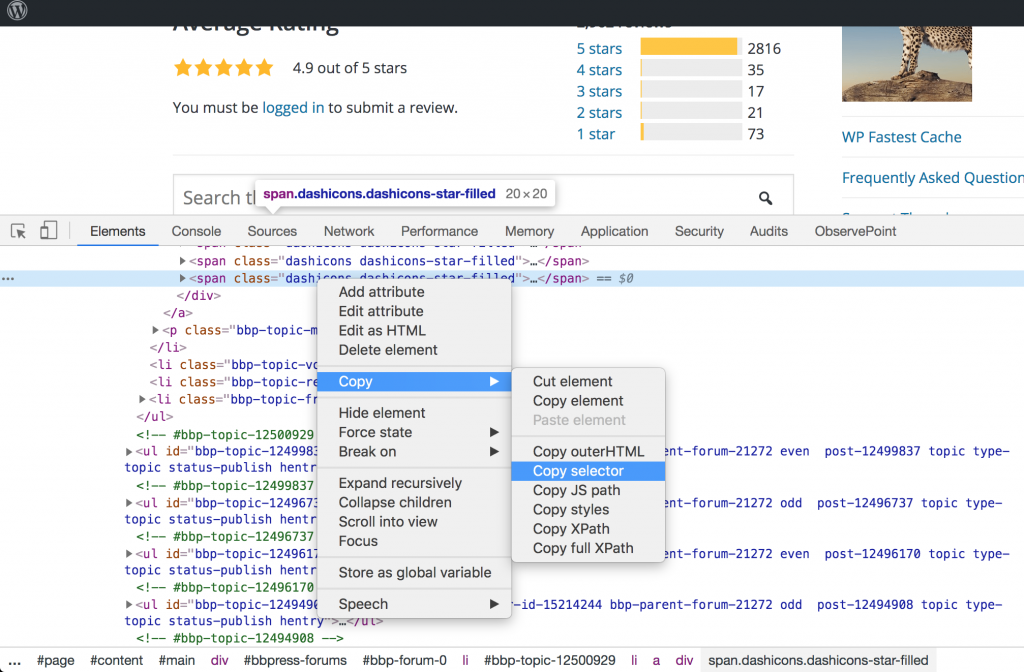
If you need help to select elements, chrome inspector is great. You can copy/paste xpath and .css style selector directly:
|
1 2 3 |
# Then we are getting every htmml attributes values into columns and rows # it's a copy/past from stackoverflow, it's works don't ask me how. extract <- bind_rows(lapply(xml_attrs(reviews), function(x) data.frame(as.list(x), stringsAsFactors=FALSE))) |
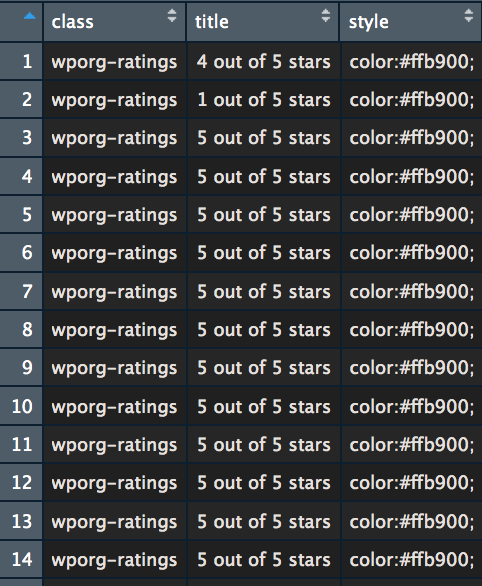
In other words, it transforms this HTML data hard to deal with
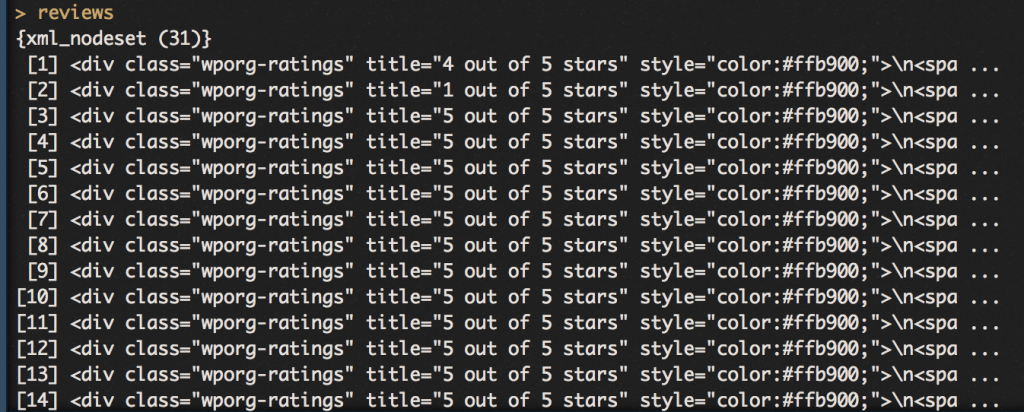
into a clean data frame with nice columns
|
1 2 3 4 5 6 7 8 9 10 11 12 13 14 15 16 17 18 19 20 21 22 23 24 25 26 27 28 29 30 31 32 33 34 35 36 |
# using the extract() function get the number of stars extract <- extract %>% extract(title,c("note")) # same process but this time to extract the duration # Grabing from the html file, the duration being displayed dates <- html_nodes(html_page, ".bbp-topic-freshness") # Extracting the real duration value from text: we remove line breaks and what's after "ago" extract$dates <- html_text(dates, trim = T) %>% str_replace_all("[\r|\n|\t]" , "") %>% str_replace_all(" ago.*$" , "") # apply duration type to values, necessary for future conversions # more info https://lubridate.tidyverse.org/reference/duration.html extract$duration <- lubridate::as.duration(extract$dates) # removing from the data frame the now useless columns & rows extract$class <- NULL extract$title <- NULL extract$style <- NULL extract$note$class <-NULL extract$note$style <- NULL extract <- extract[-1,] # erase rownames rownames(extract) <- c() # converte values to the right type extract$note <- as.vector(extract$note) extract$note <- as.numeric(extract$note) # adding all date retrieved during this loop to the main data frame 'all_reviews' all_reviews <- rbind(all_reviews, extract) ##### END OF THE LOOP ##### } |
The next step is to convert these durations into days. It’s going to be quick:
|
1 2 3 4 5 |
# .Data is the number of seconds, we divided by 86400 to have the number of days and we round it all_reviews$duration2 <- round(all_reviews$duration@.Data/86400) # Today date minus review age will give us the review date all_reviews$day <- today()-all_reviews$duration2 |
|
1 2 |
# we want to see number of stars as a category not as a scale all_reviews$note <- as.factor(all_reviews$note) |
the data is now ready, export your data or make a small graph to display it using ggplot package
|
1 2 3 |
library(ggplot2) ggplot(all_reviews, aes(x=day, fill=note))+ geom_histogram() |

this is it. I hope you find it useful. If you have problems, reach to me on twitter maybe I can help

